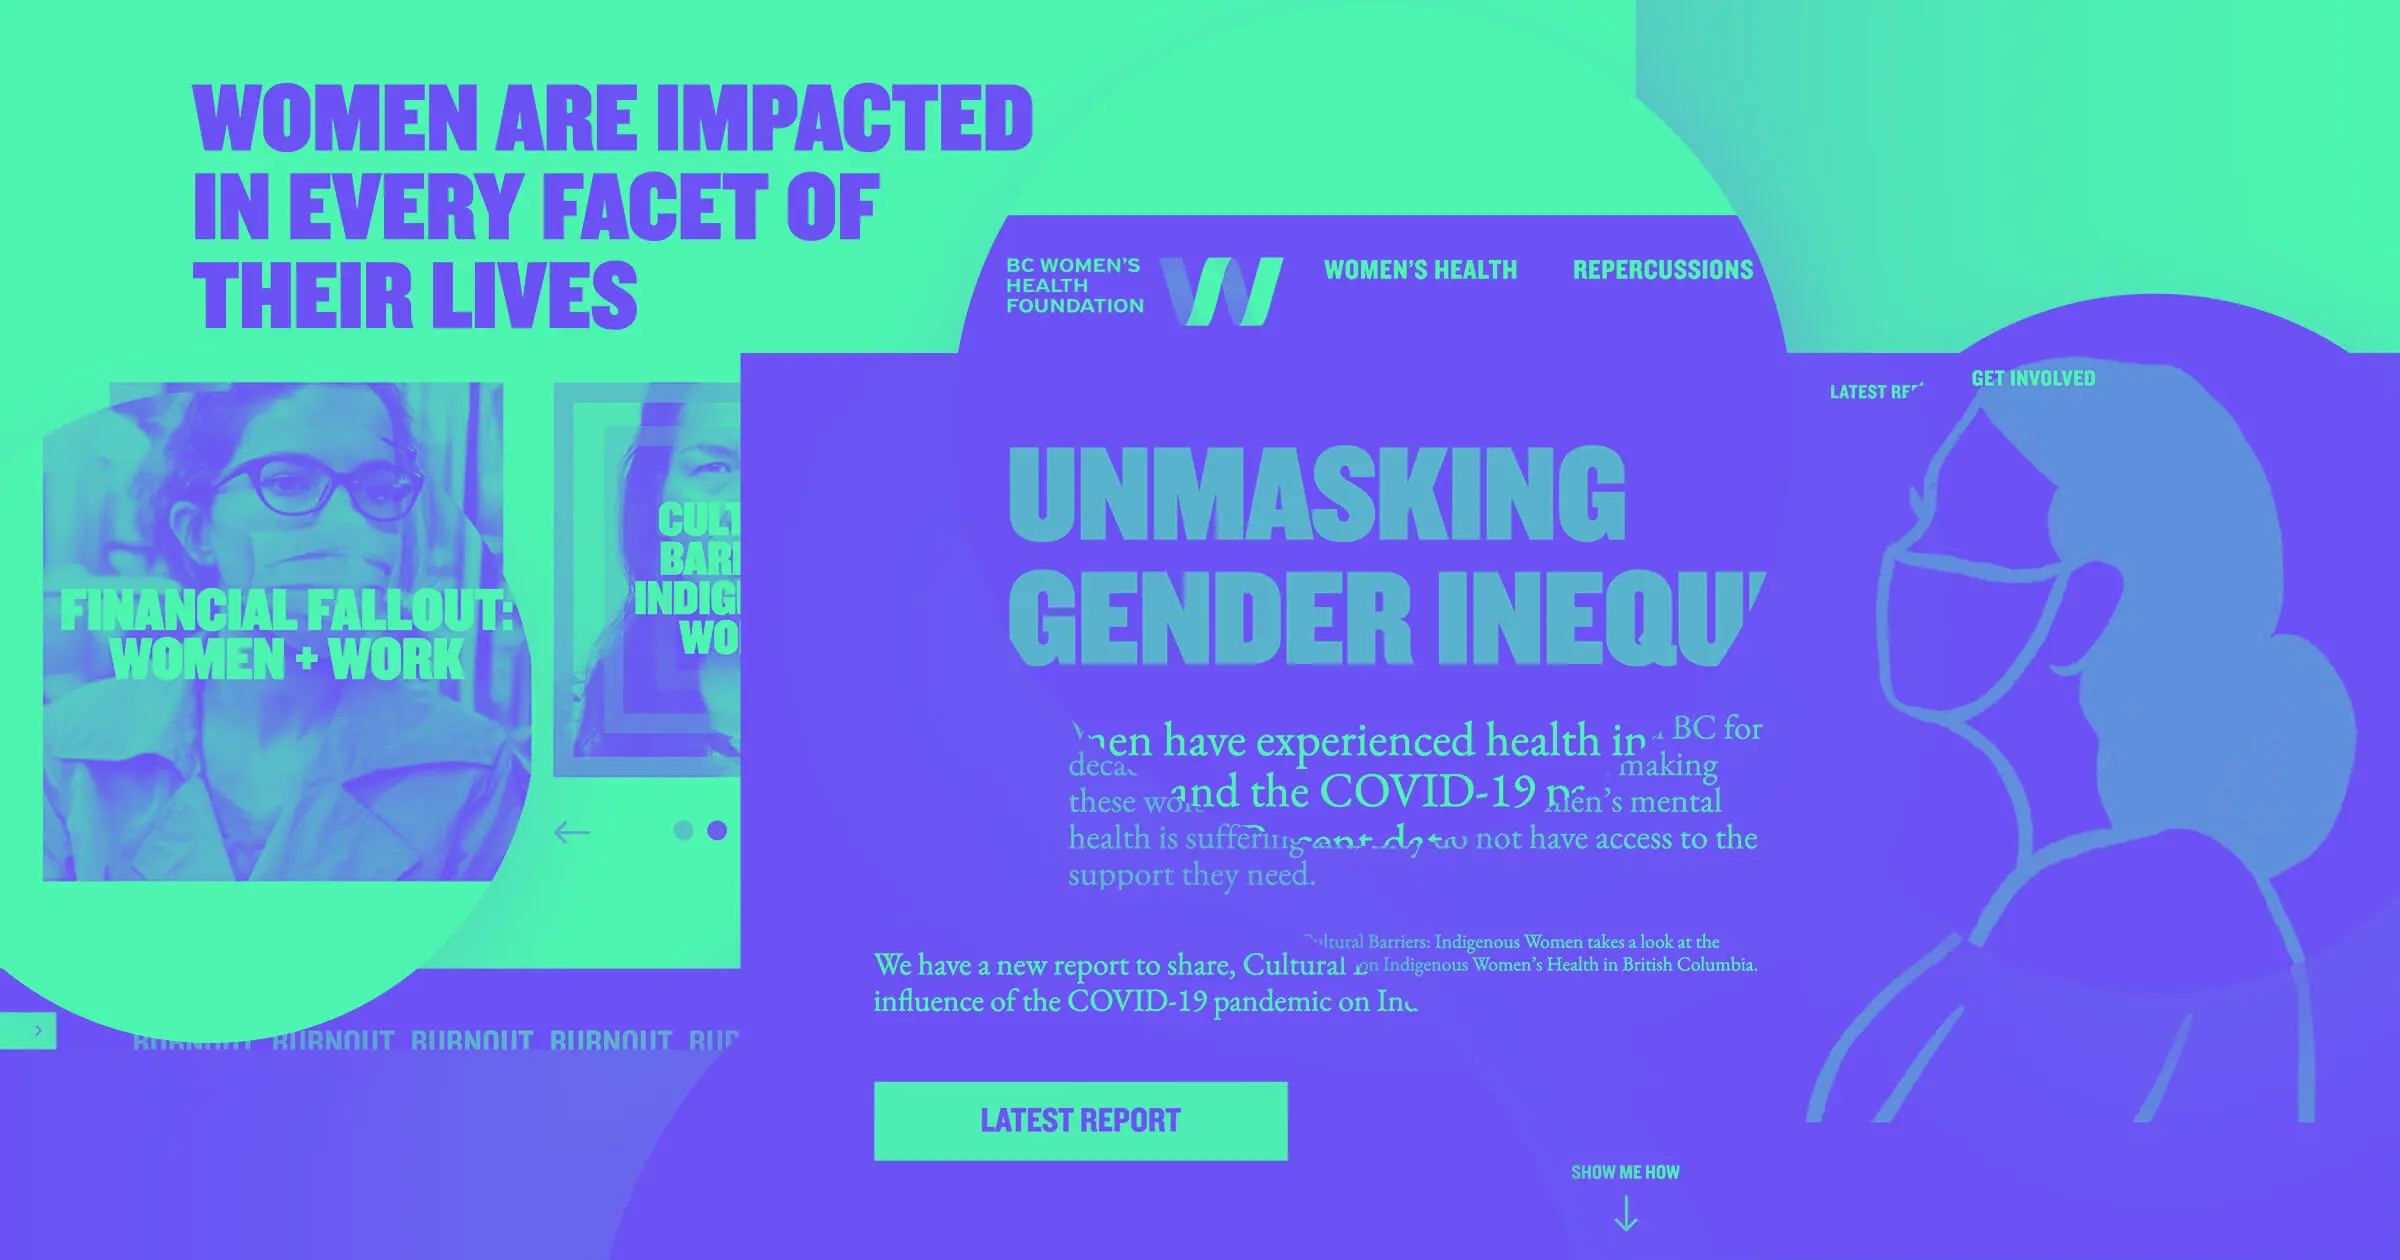

We all remember the headlines: “CDC issues warning against and guidance for large gatherings (50+)” “Wither the handshake?” “WHO declares COVID-19 a pandemic.”
If there’s anything we can gather from March 2020, it’s that we didn’t know a whole lot about the virus, how it spread, or what to do about it. Amidst the uncertainty surrounding COVID, ZOE — a health science company based in the UK — set out to learn as much as they could about the virus’s behaviors based on publicly gathered data.
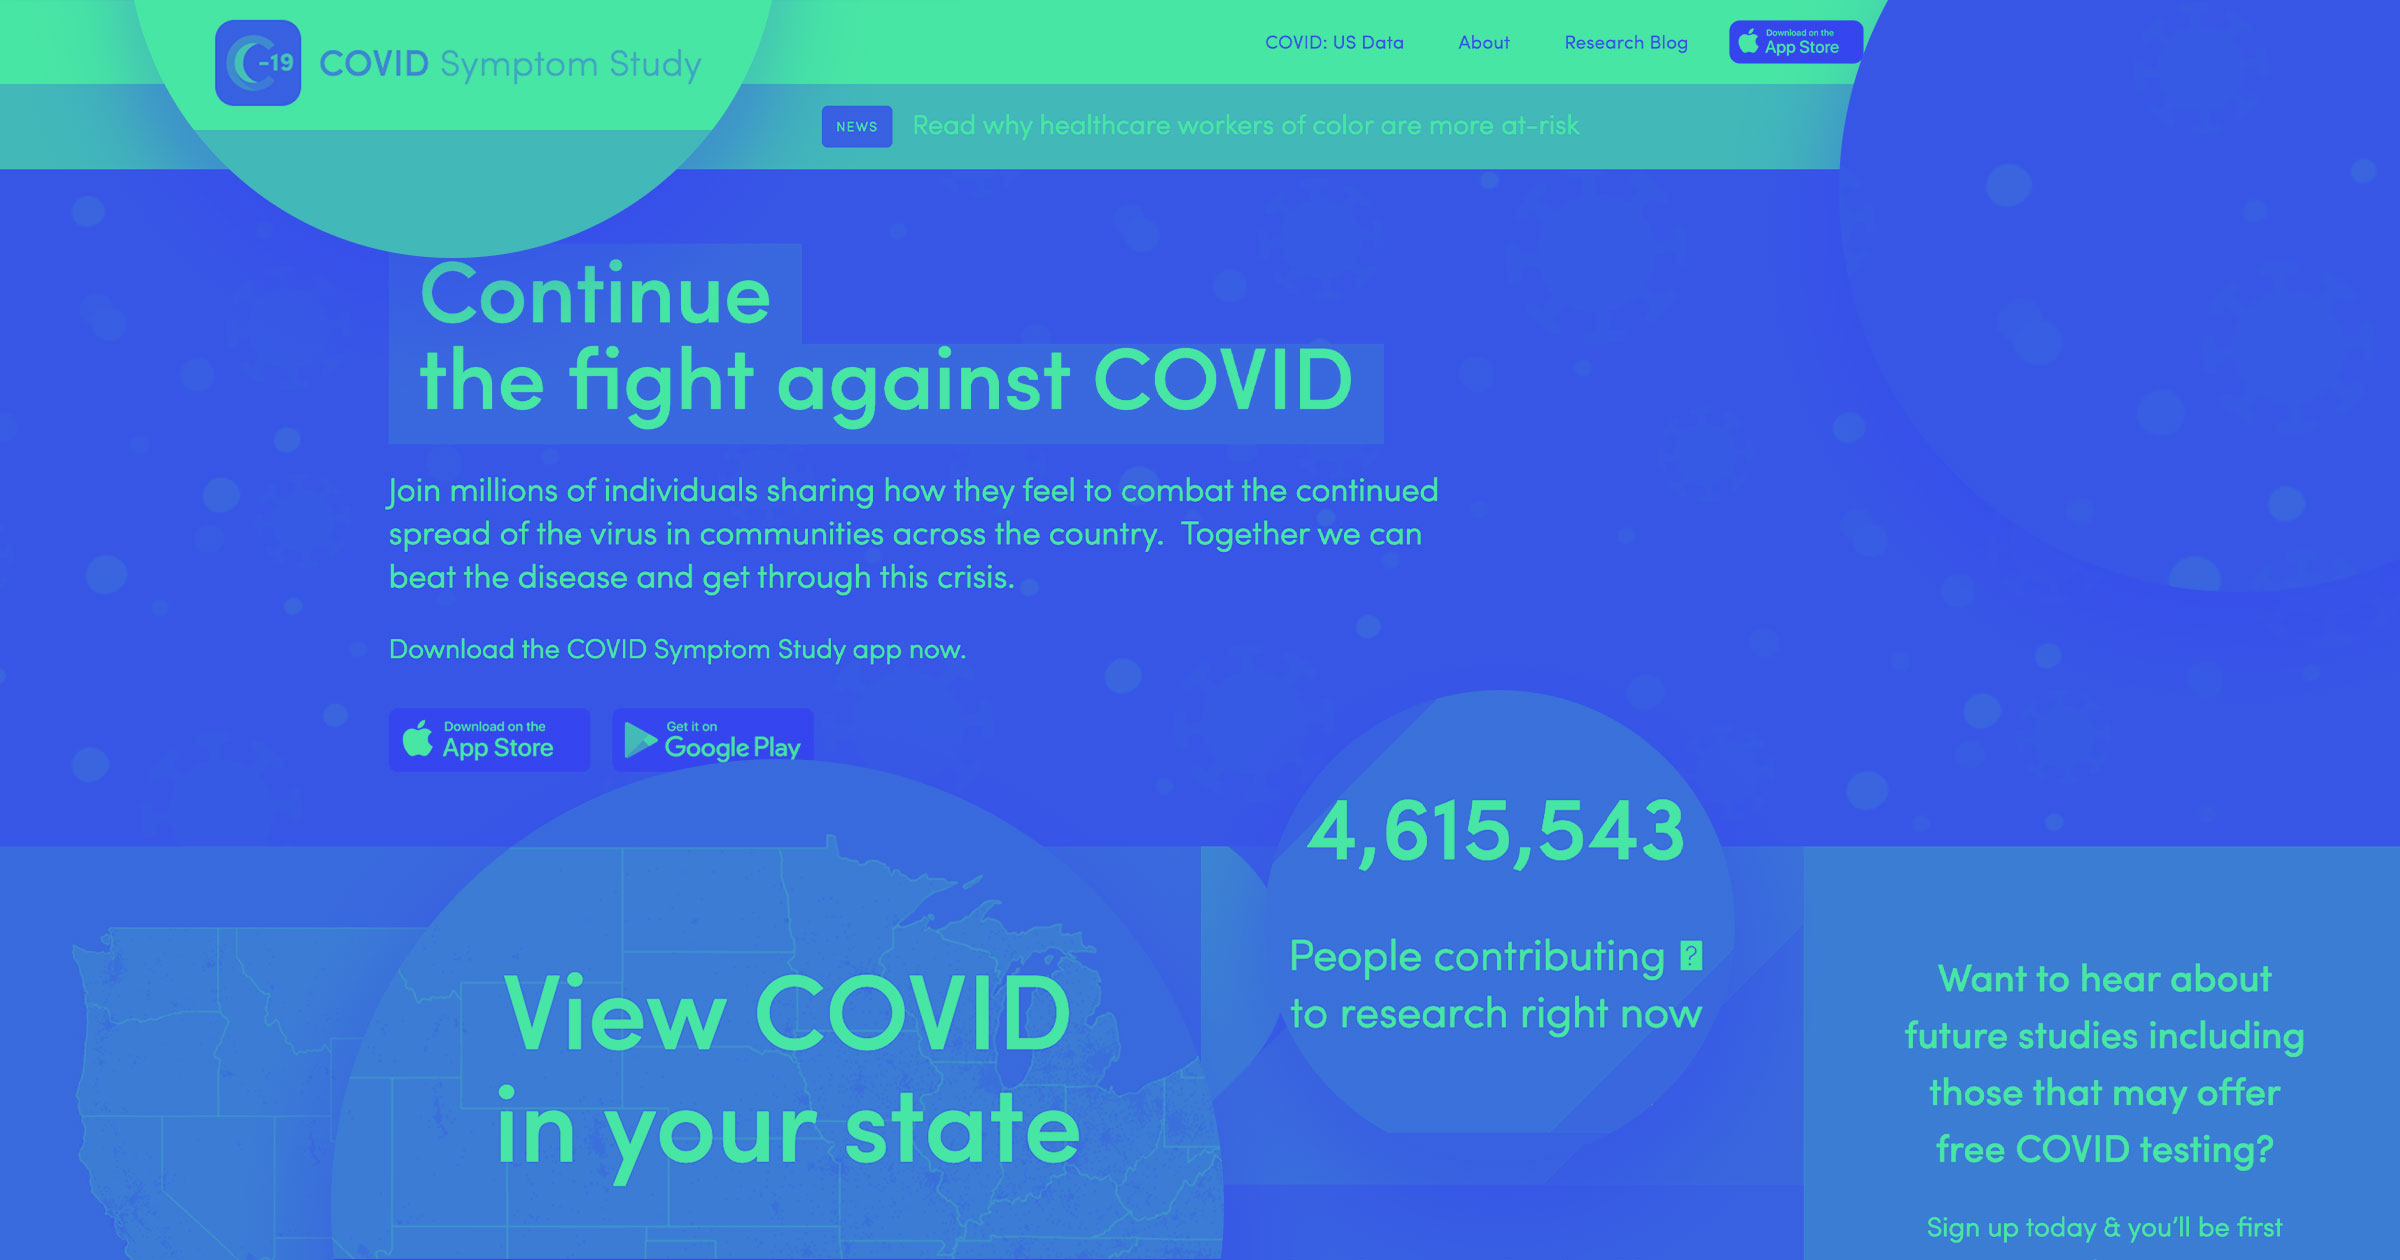
Enter: ZOE’s COVID Symptom Study. The ongoing public project is the only one of its kind with more than 4.5 million participants across the globe.
We talked to Somesh Selvachandran, Engineering Manager at ZOE, about their Symptom Study — what it is, how it came together, and how they use Webflow to help researchers and the public alike better understand the pandemic.
Act fast: launching a COVID Symptom Study in four days
ZOE is a nutrition and health science company. Their approach “combines large-scale human studies with machine learning technology, microbiome sequencing and collaboration with leading scientists around the world.” And their COVID Symptom Study is a nonprofit initiative with a purpose to understand the virus better.
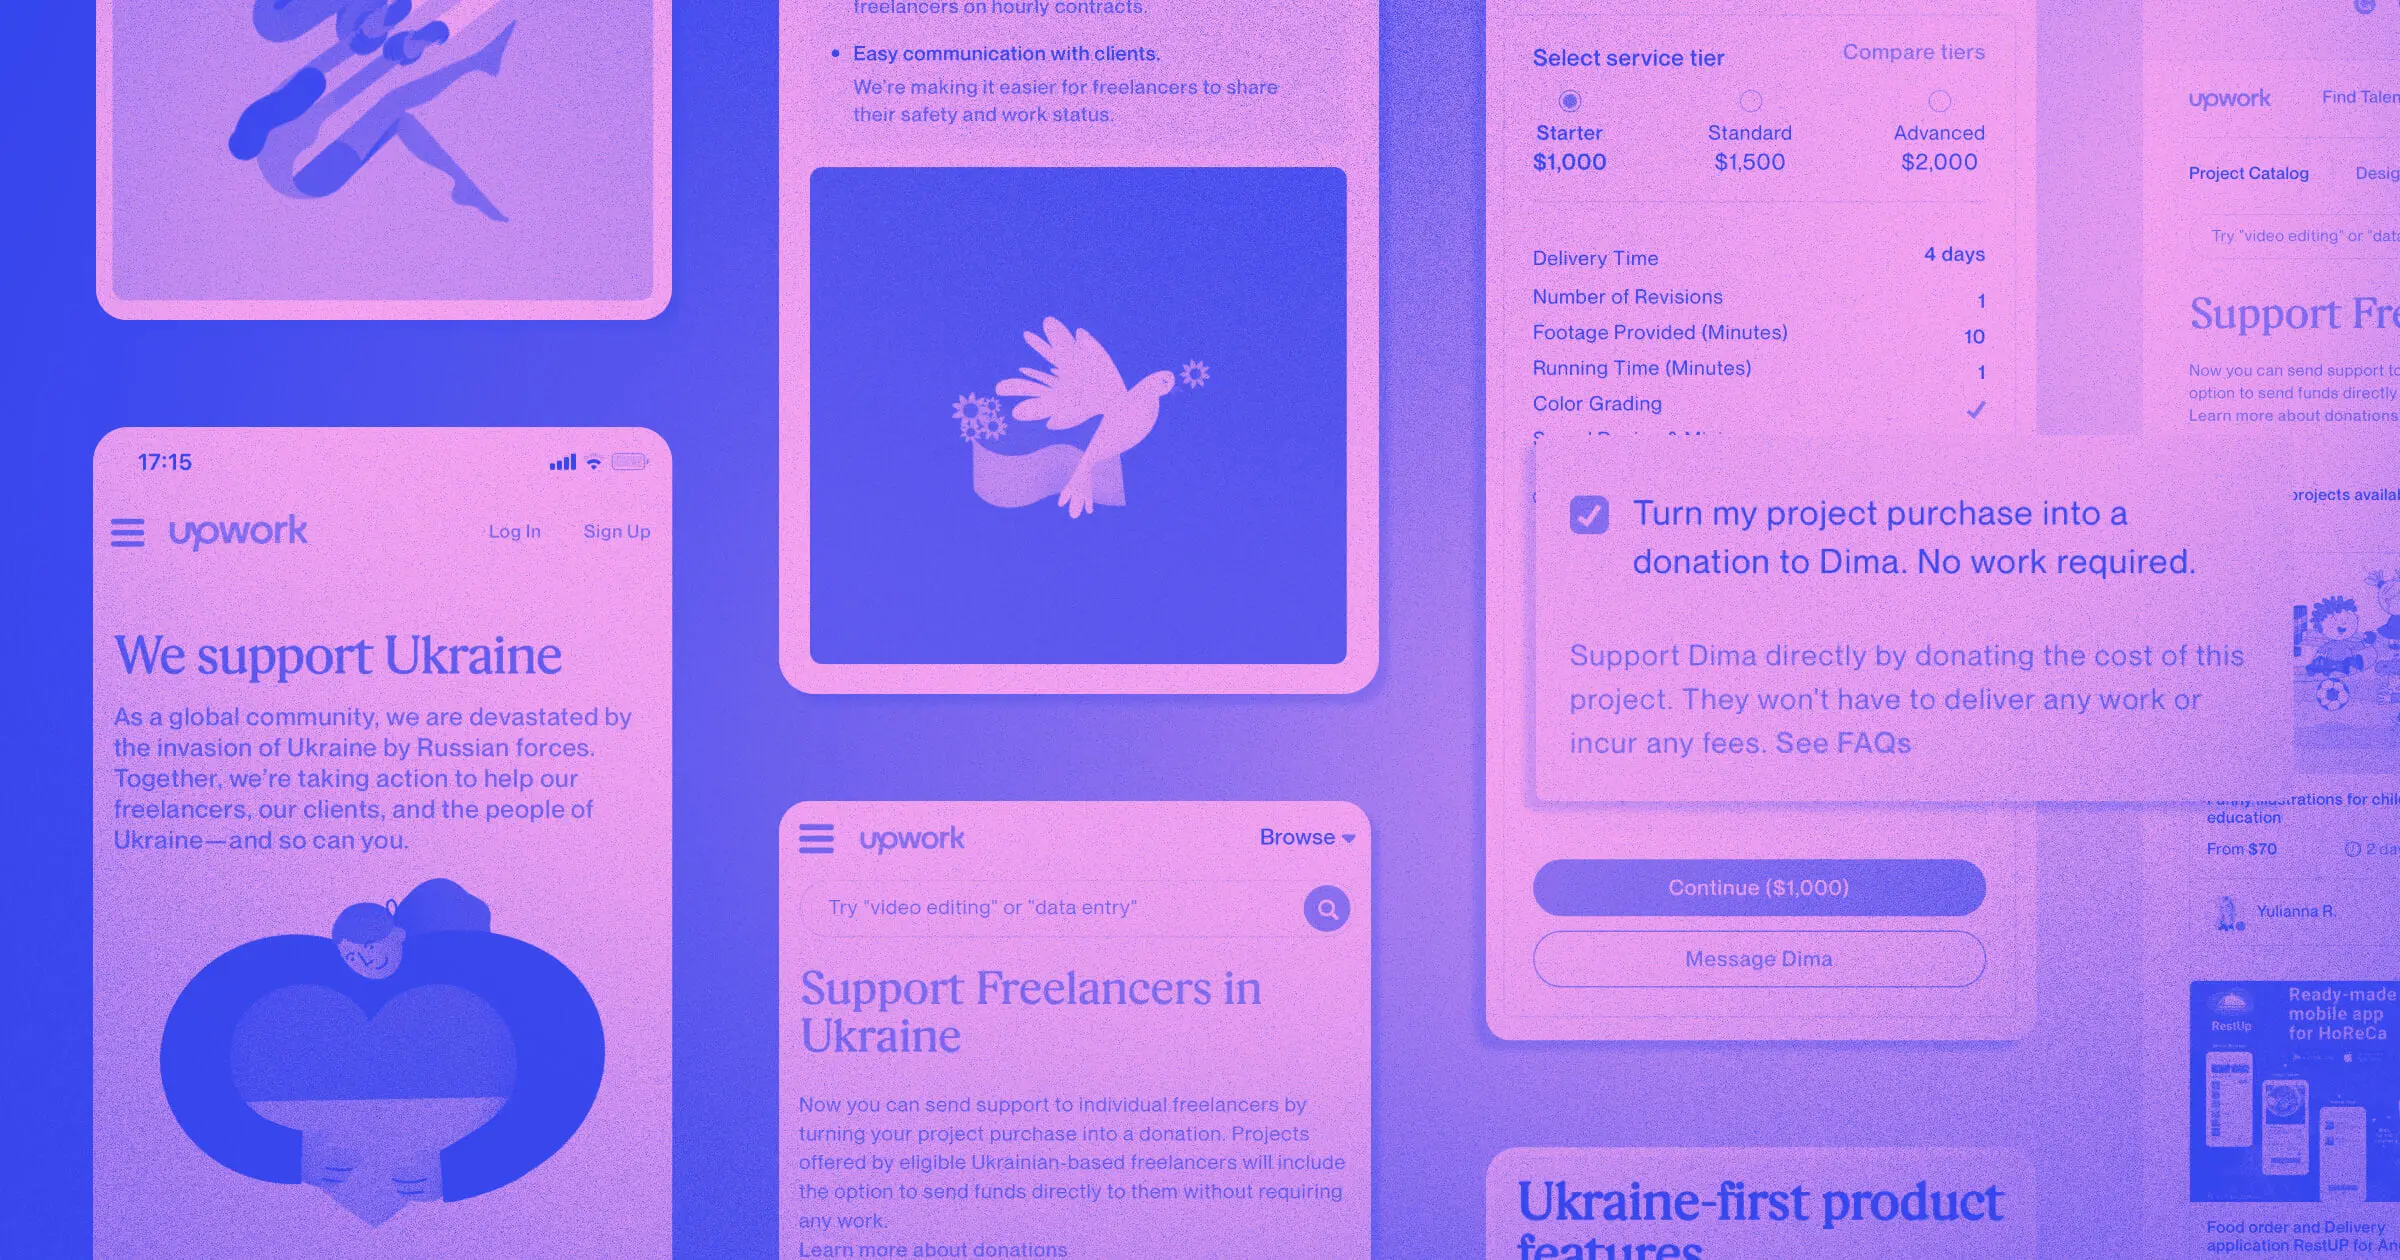
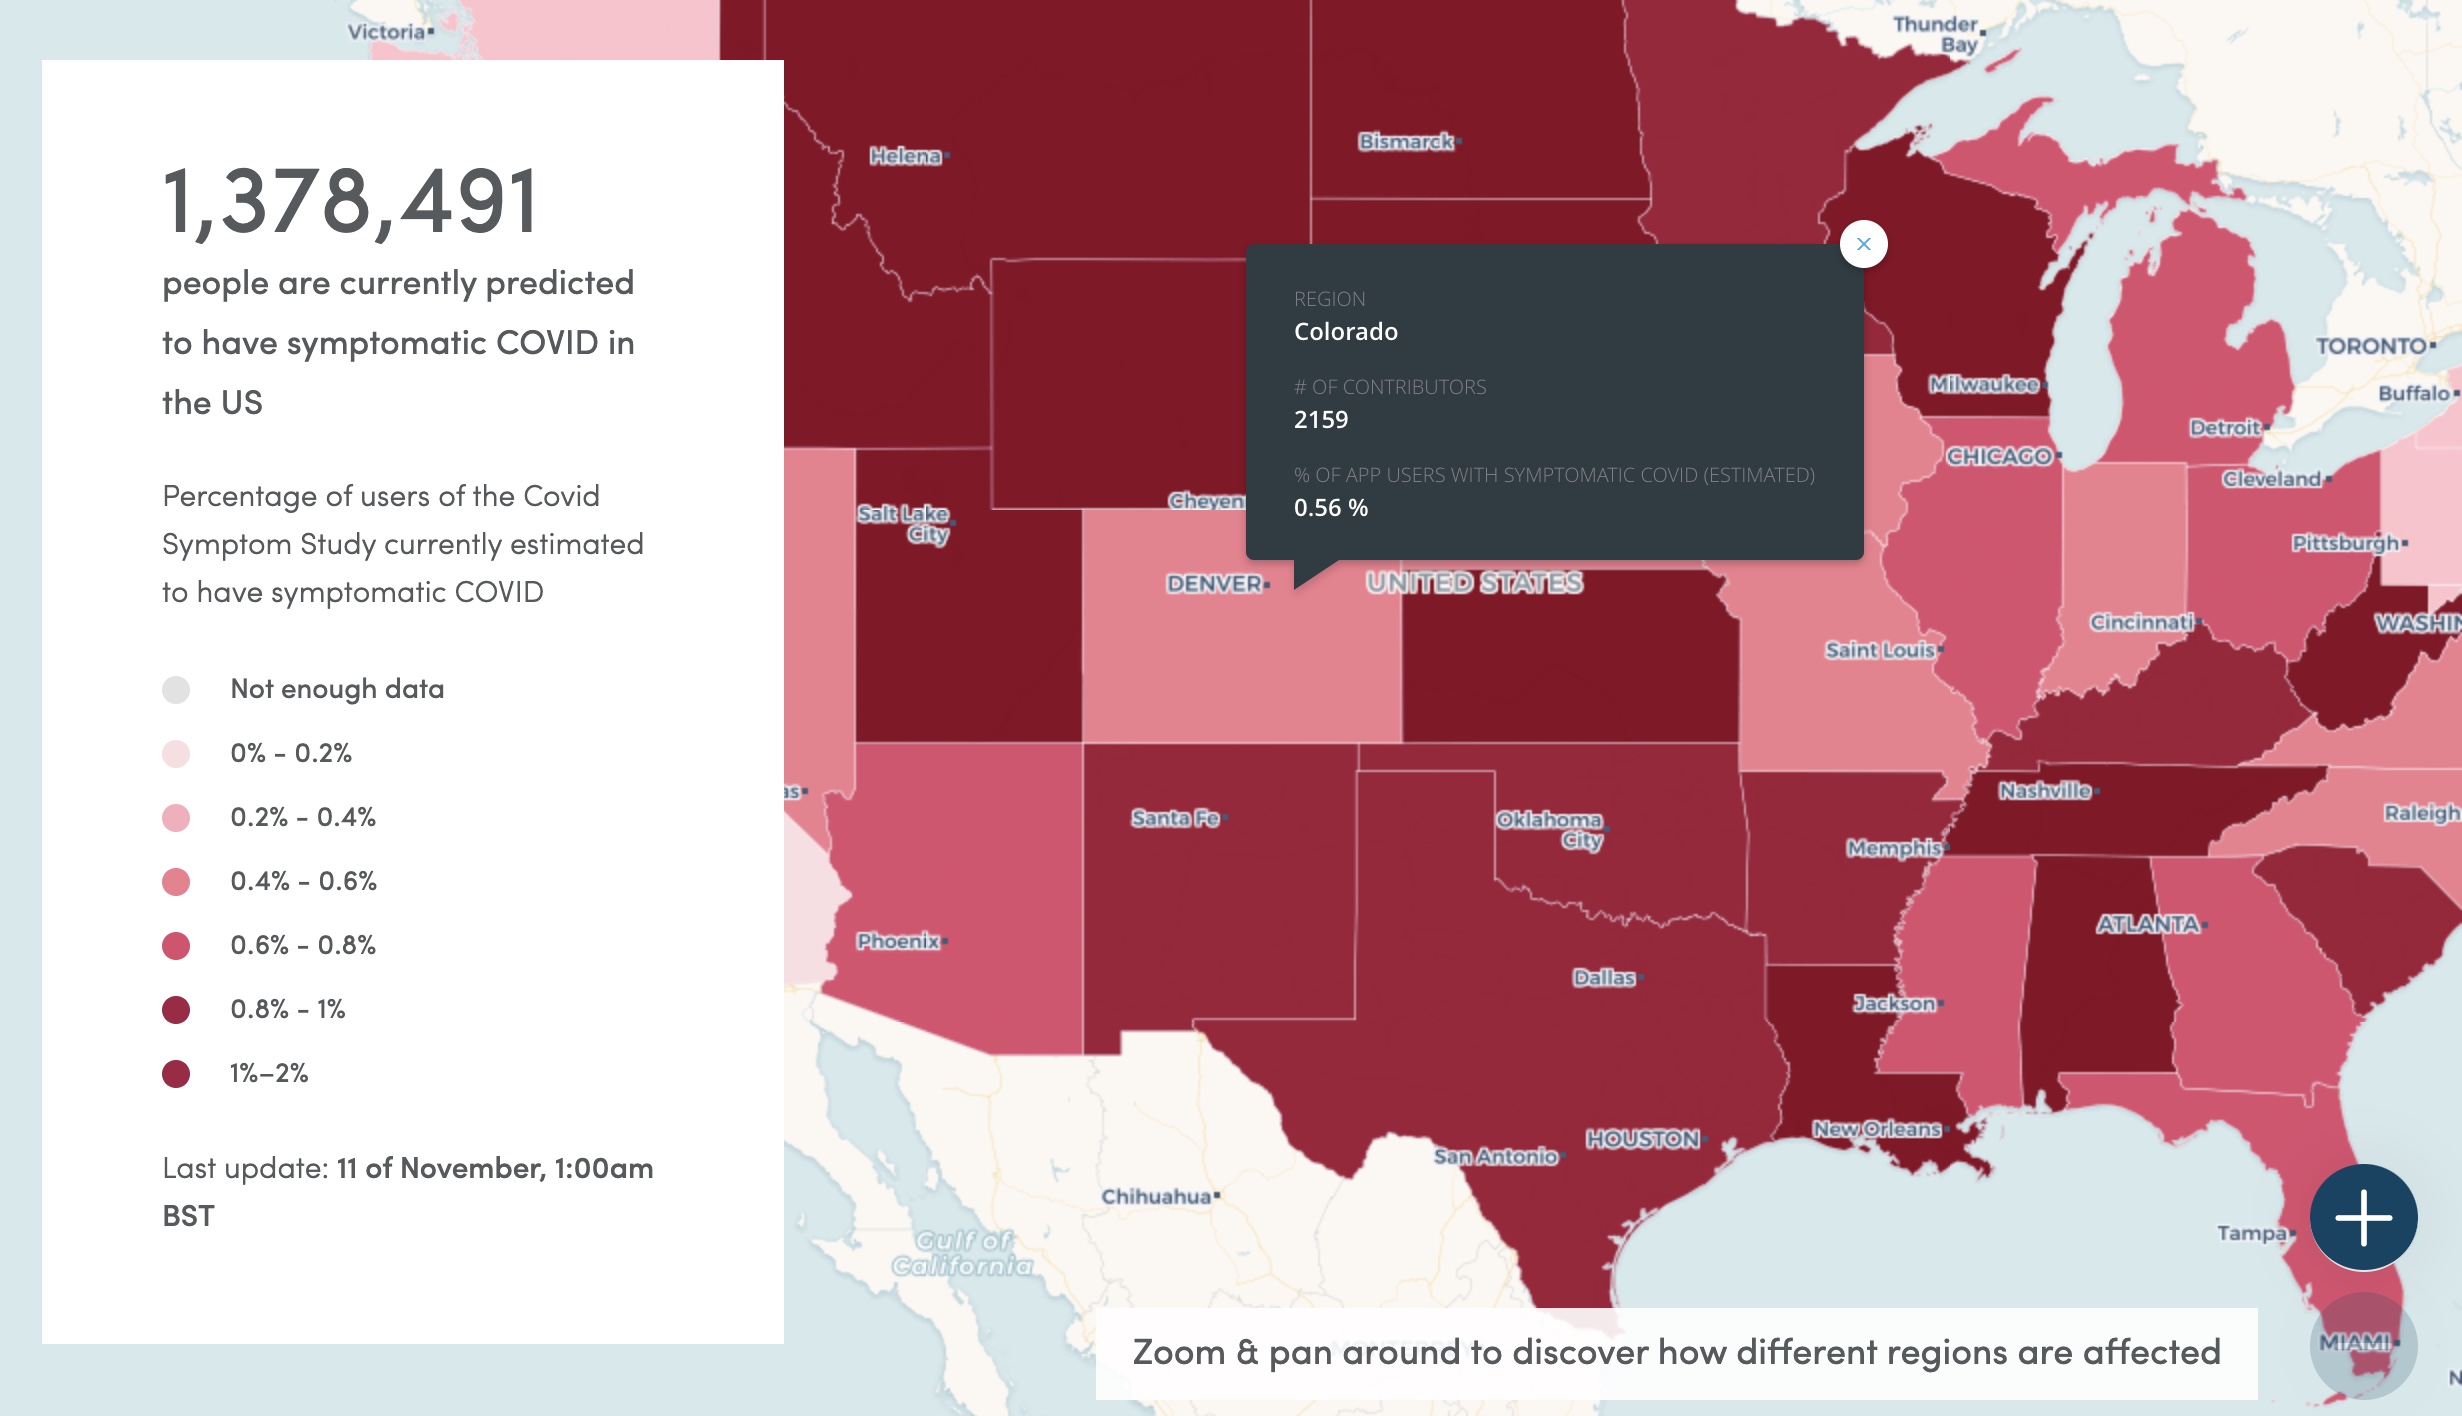
The study pairs an app, where participants log their coronavirus symptoms, test results, and vaccines, with Webflow landing pages to display real-time data gathered in-app.
The study launched in the UK in March 2020, toward the onset of the pandemic. “At that time, we didn't have much testing going on in the UK — or anywhere. People knew it was spreading, but we didn't really know how,” Somesh said. ZOE quickly jumped in to help change that by building a react native app where they could crowdsource information about COVID’s behaviors.
They developed and launched the app in just four days, and it was trusted by the public from the jump — the study had 1.5 million participants in the first 36 hours alone. It became obvious early-on that ZOE needed a way to publish the data insights gathered in-app, dynamically and interactively.
That’s where we come in: ZOE built Webflow sites to market the app and publish real-time results. Other companies also jumped in to donate software, like Cloudflare, Expo, and Sqreen, to help jumpstart their efforts. “We were able to go from nothing to something really quickly,” Somesh said. “And at that point, it was all hands on deck.”
Within the study’s first two weeks, academic institutions, researchers, and the public alike were able to pinpoint trends in the spread of the virus. Today, as the data continues to come in — after rigorous anonymization — ZOE supplies it to both internal data scientists and the UK’s SAIL Databank. “Essentially any research institution can apply to see our data,” Somesh said. They’ve received around 40 requests from institutions around the world who are using it to kickstart, or contribute to, their own research endeavors.


Build websites that get results.
Build visually, publish instantly, and scale safely and quickly — without writing a line of code. All with Webflow's website experience platform.
ZOE’s switch to Webflow was perfect timing
A few months prior to the launch of the study — knowing they needed more flexibility with less engineering involvement — they moved away from WordPress as their main CMS. “We do a lot of experimentation and A/B testing, and we want to quickly put out designs without having our engineers in there,” Somesh said.
From there, ZOE’s product and engineering teams decided to remove themselves as a bottleneck, and they did that using Webflow.
As an engineer, Selvachandran loves being able to have the Webflow CMS API push content seamlessly into the app without having an engineer manually push an update live. “We found that we have really high engagement with content, like ‘check out these blog posts’ in the app,” Somesh said. With Webflow, when users go into the app to log their symptoms, they can also interact with other content on the ZOE site.
“Having the Webflow API publish content into our mobile apps is a game changer. Especially to have all of our content in one place — and to allow our content and product teams to manage it — rather than relying on engineers.”
— Somesh Selvachandran, Engineering Manager at ZOE
Webflow also helps with public perception around the virus, especially once ZOE extended their study to the U.S. and other parts of the world. Part of their efforts to increase transparency includes having dynamic web pages, where content is updated continuously. To do that, the engineering team wrote custom code that hooked into their API and displayed the latest ZOE data on their Webflow pages.
The future of the study
Backed by impressive webpages showing real-time results, in August 2020, ZOE received UK government funding to support the expansion of the Symptom Study. In addition to the UK, they’re gathering and publishing data in the U.S. and Sweden, and exploring vaccine effectiveness along with adverse effects.
But eventually, the ZOE team is hoping to pivot the app’s usage away from COVID-19 (fingers crossed!) and toward wider public health initiatives.
"We've been amazed by the support from our customers who've shown the power citizen science can have in the fight against COVID-19. We're cautiously optimistic to see the back of this pandemic, but we hope the app will evolve to be an essential tool in understanding public health and future diseases,” Somesh said.