


You’ve perfected counting website visitors. Now learn how to glean insights from their behavior to make them stay longer.
Once you’ve nailed the basics of website analytics — tracking visitors, understanding pageviews, and monitoring bounce rates — you're ready to take your data game to the next level.
The next step in our website analytics journey teaches you how to transform raw data into strategic decisions. In this post you'll learn how to:
- Segment users
- Track meaningful engagement
- Define goals
- Analyze conversion funnels
These techniques aren't just for data scientists or marketers. As a designer, developer, or site owner, these are the skills that will help you create better user experiences based on actual behavior.
1. Segment users
Treating all website visitors as one homogenous group is like creating one-size-fits-all content. In the end, it’s so general that it doesn’t fit anyone. User segmentation helps you identify distinct visitor groups so you can build better user flows and personalize content — optimizing experiences for those distinct groups.
Start by analyzing your audience through three primary lenses:
- Demographics: Where are your visitors located? What devices do they use? When do they visit?
- Behavior patterns: Which visitors consume multiple content pieces? Who bounces immediately? Who engages with interactive elements?
- Acquisition channels: Do social media visitors behave differently than organic search visitors? Does a high percentage of your traffic come from a certain channel?
Once you've identified meaningful segments, you can adjust layouts, navigation, and performance to better match how different groups interact with your site. For example, visitors coming from paid advertising might expect faster page load times, so you could streamline those landing pages by reducing heavy images or other elements slowing it down.
Notice you have a high proportion of website visitors from a certain country or that speak a certain language? It might be notable feedback to pass along to your sales team, and a good opportunity to explore localization strategies.
Tip: Webflow Analyze gives you visibility into your global audience demographics, showing which countries your visitors are coming from, what devices they’re using to browse your site and what languages they speak — all without leaving the platform.
2. Track meaningful engagement
Pageviews and bounce rates are helpful to understand basic engagement, but these metrics don't capture deeper insights on the effectiveness of your content or pages. Engagement tracking helps you understand, at a deeper level, how users consume your content. Here are a few examples:
- Scroll depth: How far do visitors make it down your pages? Are they reaching your key messages? Set up tracking at 25%, 50%, 75%, and 100% to identify where interest drops off.
- Interactive element engagement: Which buttons, forms or calculators are visitors actually using?
- Time on page: Not all pageviews are created equal. Are visitors staying and engaging with your content? Or are they moving on quickly?
- Return visits: Who comes back for more? Return visitors signal content that resonates.
These deeper engagement metrics help you identify which areas of your site perform well and resonate with your audiences’ needs, and which sections could use refinement.
For example, if you notice that users drop off early at a certain point on your page, try repositioning key CTAs at that drop off point, or break up text heavy sections with engaging visual elements to keep them scrolling further down.
If you notice low time on page metrics for a product page, experiment with interactive expandable sections for specs, reviews, and FAQs to keep the experience engaging and educational. Tracking clicks on those expandable sections can also give your team feedback on what information most prospective buyers are seeking.
Tip: Webflow Analyze can track click events on interactive elements without requiring any code setup. This gives you insights into which buttons, links, and navigation items visitors engage with most.
3. Define goals
Website analytics become more powerful when you define clear goals for your site and individual pages. Goals give metrics meaningful context.
To start, define what "success" means for different parts of your site:
- Primary conversion goals: These represent your site's main purpose — newsletter signups, contact form submissions, product purchases, or demo requests.
- Secondary engagement goals: These track meaningful interactions that indicate interest but aren't yet conversions by your definition (video views, resource downloads, or tool usage).
- Page-specific goals: Different pages serve different purposes. Your homepage might aim for navigation to key sections, while a product page might aim for scheduling a demo or starting a free trial.
Define goals that serve both visitor needs and business objectives. This intentionality will support users achieving their goals (learning more about your business or becoming a customer or community member), while naturally advancing your goals.
Tip: Webflow Analyze can track goals across your site — monitoring key CTAs such as form submissions and button clicks. You can group and define specific elements across your site as a goal, and measure conversion rates without code or any external tools.
4. Analyze conversion funnels
Funnel analysis transforms isolated pageviews into meaningful user stories, revealing how visitors navigate toward — or away from — conversion. By visualizing these movement patterns, you can find opportunities to improve how users navigate your site and remove friction points. Some ways to connect the dots across your visitor journey:
- Identify valuable sequences: Discover high-converting pathways (like visitors who view your pricing page after a certain customer story and convert at twice the rate).
- Pinpoint drop-off hotspots: Find exactly where visitors abandon their journey and why.
- Bridge expectation gaps: Compare your ideal user flows with actual behavior to understand the biggest optimization opportunities.
- Tailor paths to visitor context: Design separate flows for the different navigation patterns of returning visitors and first-time browsers.
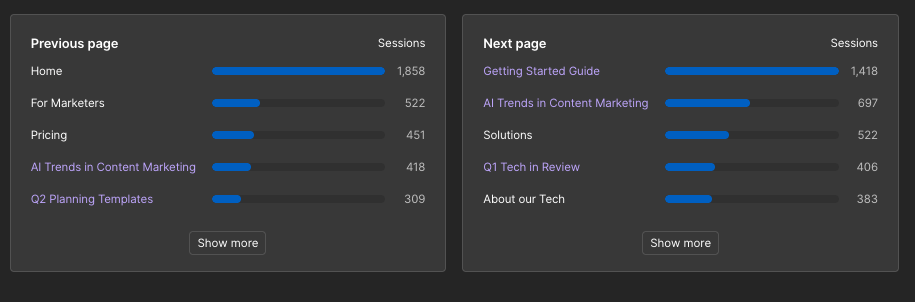
Tip: Webflow Analyze provides page-to-page navigation flow data to show the journey a visitor takes before and after landing on a given page. Using this data, you can optimize navigation elements, strengthen natural conversion pathways and remove any points of friction that could be limiting conversions.
Webflow Analyze: Drive your designs with data
Website analytics is about more than just watching numbers. It's about using data to inform strategy and drive better design and content decisions.
Ready to make it happen? Webflow Analyze gives you the clear, accessible insights you need to understand visitor behavior and transform that context into improvements that drive results.


Start using Analyze today
Webflow Analyze puts a native, unified view of visitor behavior into the hands of designers and content marketers — so you can make data-backed decisions that improve site performance.