If you aren’t leveraging data to inform your website decisions, you’re missing out on critical revenue driving opportunities.
Teams managing websites are faced with making choices constantly. From CTA placement to understanding their core audience, content editors, designers, and developers need to align their decisions with key business goals to maximize revenue and attribute their efforts to real business value.
To do this, these teams need actionable data.
In this post, we cover the basics of website analytics and reveal how we’re making website data accessible and actionable for everyone.
Website analytics overview
Website analytics refers to the process of measuring, collecting, and analyzing data about website visitors and their behavior. They are a treasure trove of information about your visitors — who they are, where they’re located, what devices they use, what content they’re engaging with, and more.
Website analytics are the true unlock in understanding what about your website is working and what’s not, providing a clear picture of overall website performance. Once a baseline for website performance is established, you can take it one step further and develop website testing and experimentation programs to refine the user experience and maximize conversions.
Before we get into the power of using analytics to improve engagement with your site, let’s cover some basic terminology.
Metrics and terminology
There’s a standard set of terms that most website analytics tools will use in assessing data about website traffic:
- Visitors, sometimes called unique visitors: The total number of new and returning visitors to your website within a given timeframe.
- Sessions: A session represents a single visit to your website, including all interactions, page views, etc. a visitor has before leaving or becoming inactive.
- Session duration: The average amount of time visitors spend on your website per session.
- Time on page: Average amount of time visitors spend on a given page.
- Pageviews: The total number of pages viewed across all sessions.
- Bounce rate: The percentage of visitors who leave without interacting with your website or visiting another page.
- Clicks: Track what elements are most clicked on your website (navigation options, interactive elements, etc.)
- Click-through rate (CTR): Analyzes how often users click on specific elements, such as links, buttons, or CTAs.
- Scroll depth: Tracks how far users scroll down a page.
- Conversion rate: Measures the percentage of visitors who complete a desired action on your website.
These metrics work together to help understand visitor behavior. By understanding how visitors interact with your website, you can make any number of improvements to optimize their user experience and your website’s overall impact on your business.
Setting goals for growth: Sitewide vs. per-page optimization
Next, it's important to understand how to align performance or business goals with website analytics. First, there are sitewide goals which focus on broader metrics such as overall conversion rate and bounce rate, providing a picture of how the entire website is performing. Second, per-page goals are more granular, tracking specific actions on individual pages (such as form submissions on a contact page or pricing page). While sitewide goals provide an idea of general trends and business impact, per-page goals allow brands to dial in on more targeted optimization opportunities.
Some common pages to configure goals for include:
- Homepage
- Blog or content pages
- Contact page
- Product or service pages
- Checkout page
As the SEO landscape impacts traffic, teams need to focus their goals on concrete business objectives rather than vanity metrics like jumps in traffic that don’t convert. In today’s environment, conversions drive business growth so the importance of optimizing for per-page and sitewide goals cannot be overstated.
Traffic sources and acquisition
In addition to basic dashboard reporting language and goal setup, it’s important to know where your website visitors come from. Below are common website traffic sources:
- Direct: These are visitors who type your URL directly into their browser or access your website from a saved bookmark.
- Organic: These visitors find your website through unpaid search engine results.
- Paid: These are visitors who land on your website through paid advertising campaigns, such as Google Ads or social media promotions.
- Social: Organic traffic generated from social media platforms.
- Referral: Visitors who land on your website by clicking links from other websites.
- Email: Visitors who click links in email campaigns or newsletters.
Traffic source data informs key parts of a website strategy. If you notice pages you want high traffic volumes for are coming from social, consider testing your web copy for improved SEO to drive more organic traffic growth.
Pulling it all together
Now that we have a basic understanding of the terminology and concepts, let’s look at how a team can pull this together to drive a better user experience and higher conversions.
Example:
A team learns by looking at scroll depth data that many of their visitors scroll past their demo request CTA without clicking and filling out their form. To optimize their page for conversion, the team starts to test the demo request CTA placement, and experiments with ways to make the CTA more visually prominent.
Through separate analysis, the team finds that data shows visitors spend more time engaging with product benefit sections, so they refine their messaging to better highlight the value of a demo, and move their CTA placement closer to the information supporting a demo request.
Leveraging key website data, the team is able to enhance the user experience by understanding how visitors are engaging with their website and eliminating points of friction, simultaneously streamlining demo requests to boost conversions and revenue.
Meet Webflow Analyze
To connect these pieces one step further, you need the right tool in place to provide the data to inform your strategy. That’s where Webflow Analyze comes in.
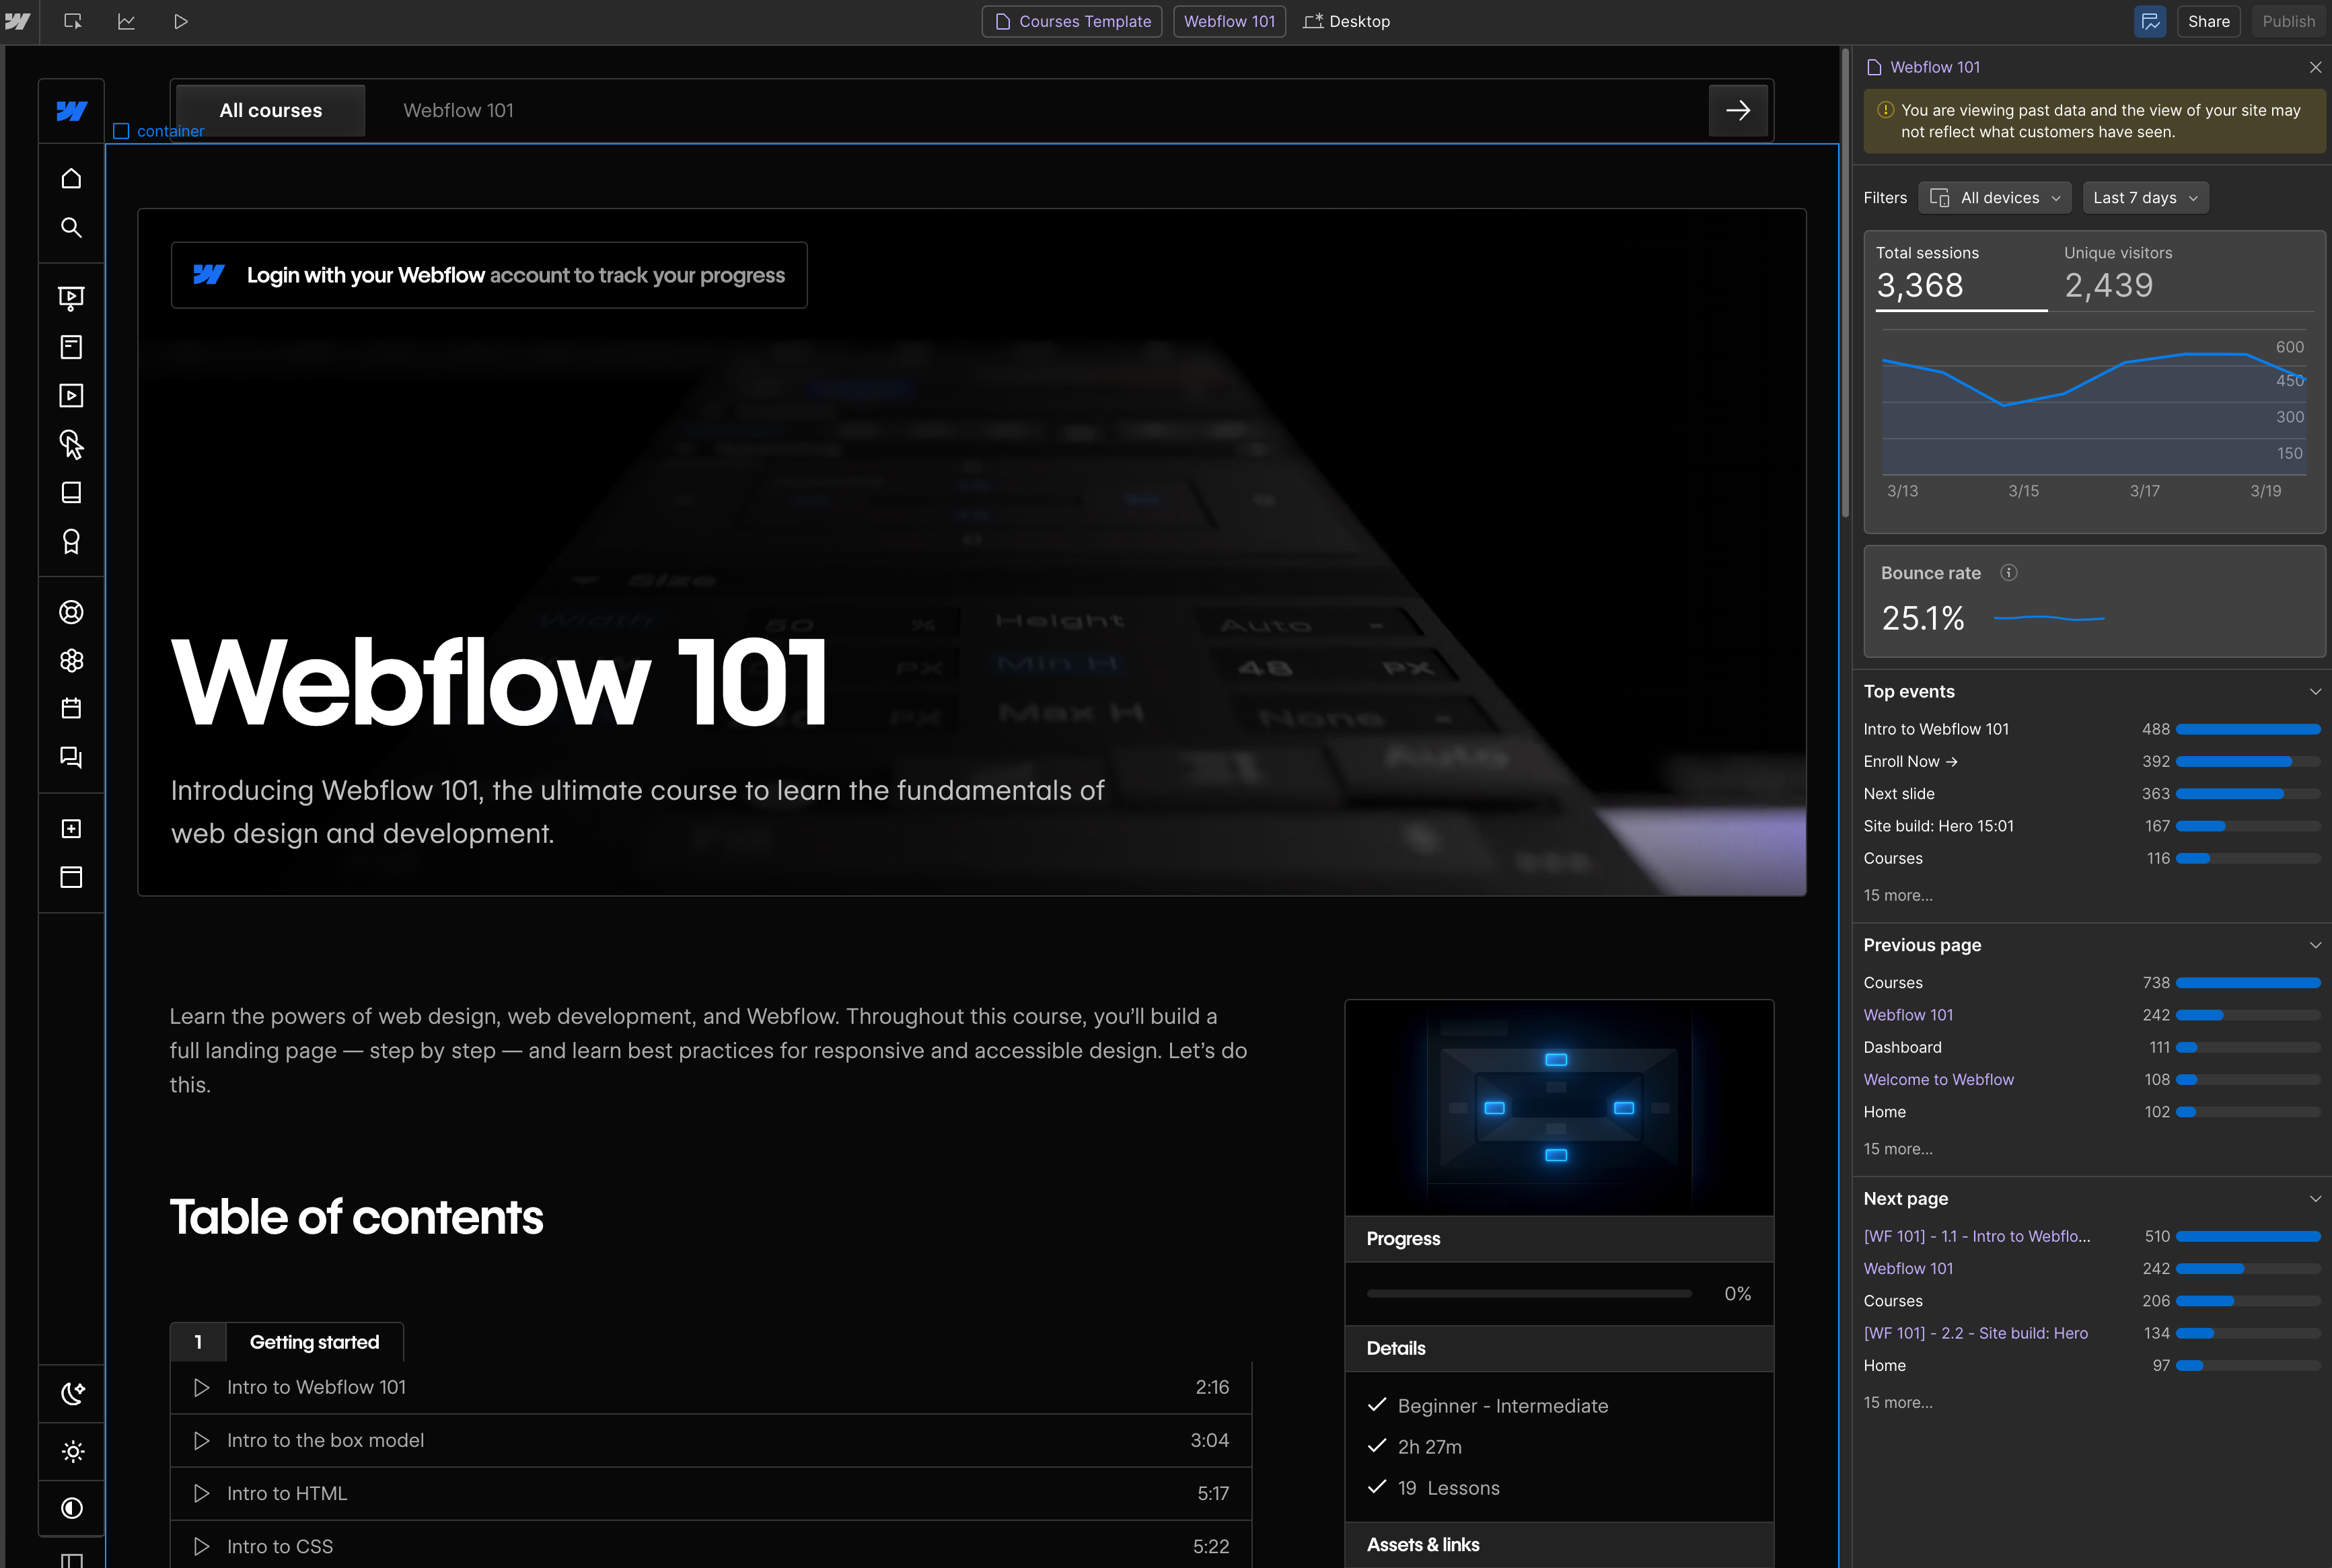
Webflow Analyze provides built-in website analytics that make it easy for teams to understand key website metrics — no code or tagging required. With contextual insight summaries highlighting key points of interest — top pages, top events, visitor journeys, etc. — it's a powerful tool that transforms insights into actionable strategies in seconds.
Webflow Analyze streamlines decision making in a few ways:
- Designers can validate hypotheses and prove that Page A outperforms Page B in driving conversions, providing leadership with key recommendations.
- Content editors can make smart decisions about where to prioritize efforts on page optimization to get the most return on their time.
- Designers can look at engagement metrics and understand their most effective CTAs and then refine page layouts for optimal user experience.
Teams can bring this data up side-by-side as they design right in Webflow, a seamless extension of their existing workflows.

The team at Walker & Dunlop uses Webflow Analyze as a key lever to use better data to scale their impact. “Recently, we realized we didn’t know how often a certain navigation bar button was used, so I hopped into Webflow Analyze and had the answer in 10 seconds” says Allison Phillips, Senior Digital Marketing Manager. “Being able to use those kinds of insights so easily and in real time is huge.”
Take action with analytics
Decisions become much easier when you have access to the right insights from your analytics. Having a tool like Webflow Analyze right alongside you in building your website experience makes it significantly easier to make your data actionable.
Now that you have your foundations in analytics set, you’re ready to make revenue-driving decisions for your website.
Learn more about Webflow Analyze and discover how it can help you deliver a better visitor experience and more conversions today.


Start using Analyze today
Webflow Analyze puts a native, unified view of visitor behavior into the hands of designers and content marketers — so you can make data-backed decisions that improve site performance.


