


New powerful performance insights available directly in the canvas, where you’re already working.
As websites grow more essential to business success, the pressure to understand what’s working (and what’s not) has grown too. But getting those insights still proves to be difficult.
Most analytics tools live outside the creative workflow, in separate dashboards (and sometimes separate teams), built for postmortems, not real-time decisions. The result? Teams miss key windows of opportunity for adjustments or worse — they miss optimization opportunities entirely.
With the launch of visual analytics, now available in Webflow Analyze, we’re changing that.
What are visual analytics?
Visual analytics bring behavioral data to life, by layering it directly onto your site. Instead of digging through dashboards or interpreting abstract metrics, you get a clear, visual understanding of how people interact with your pages.
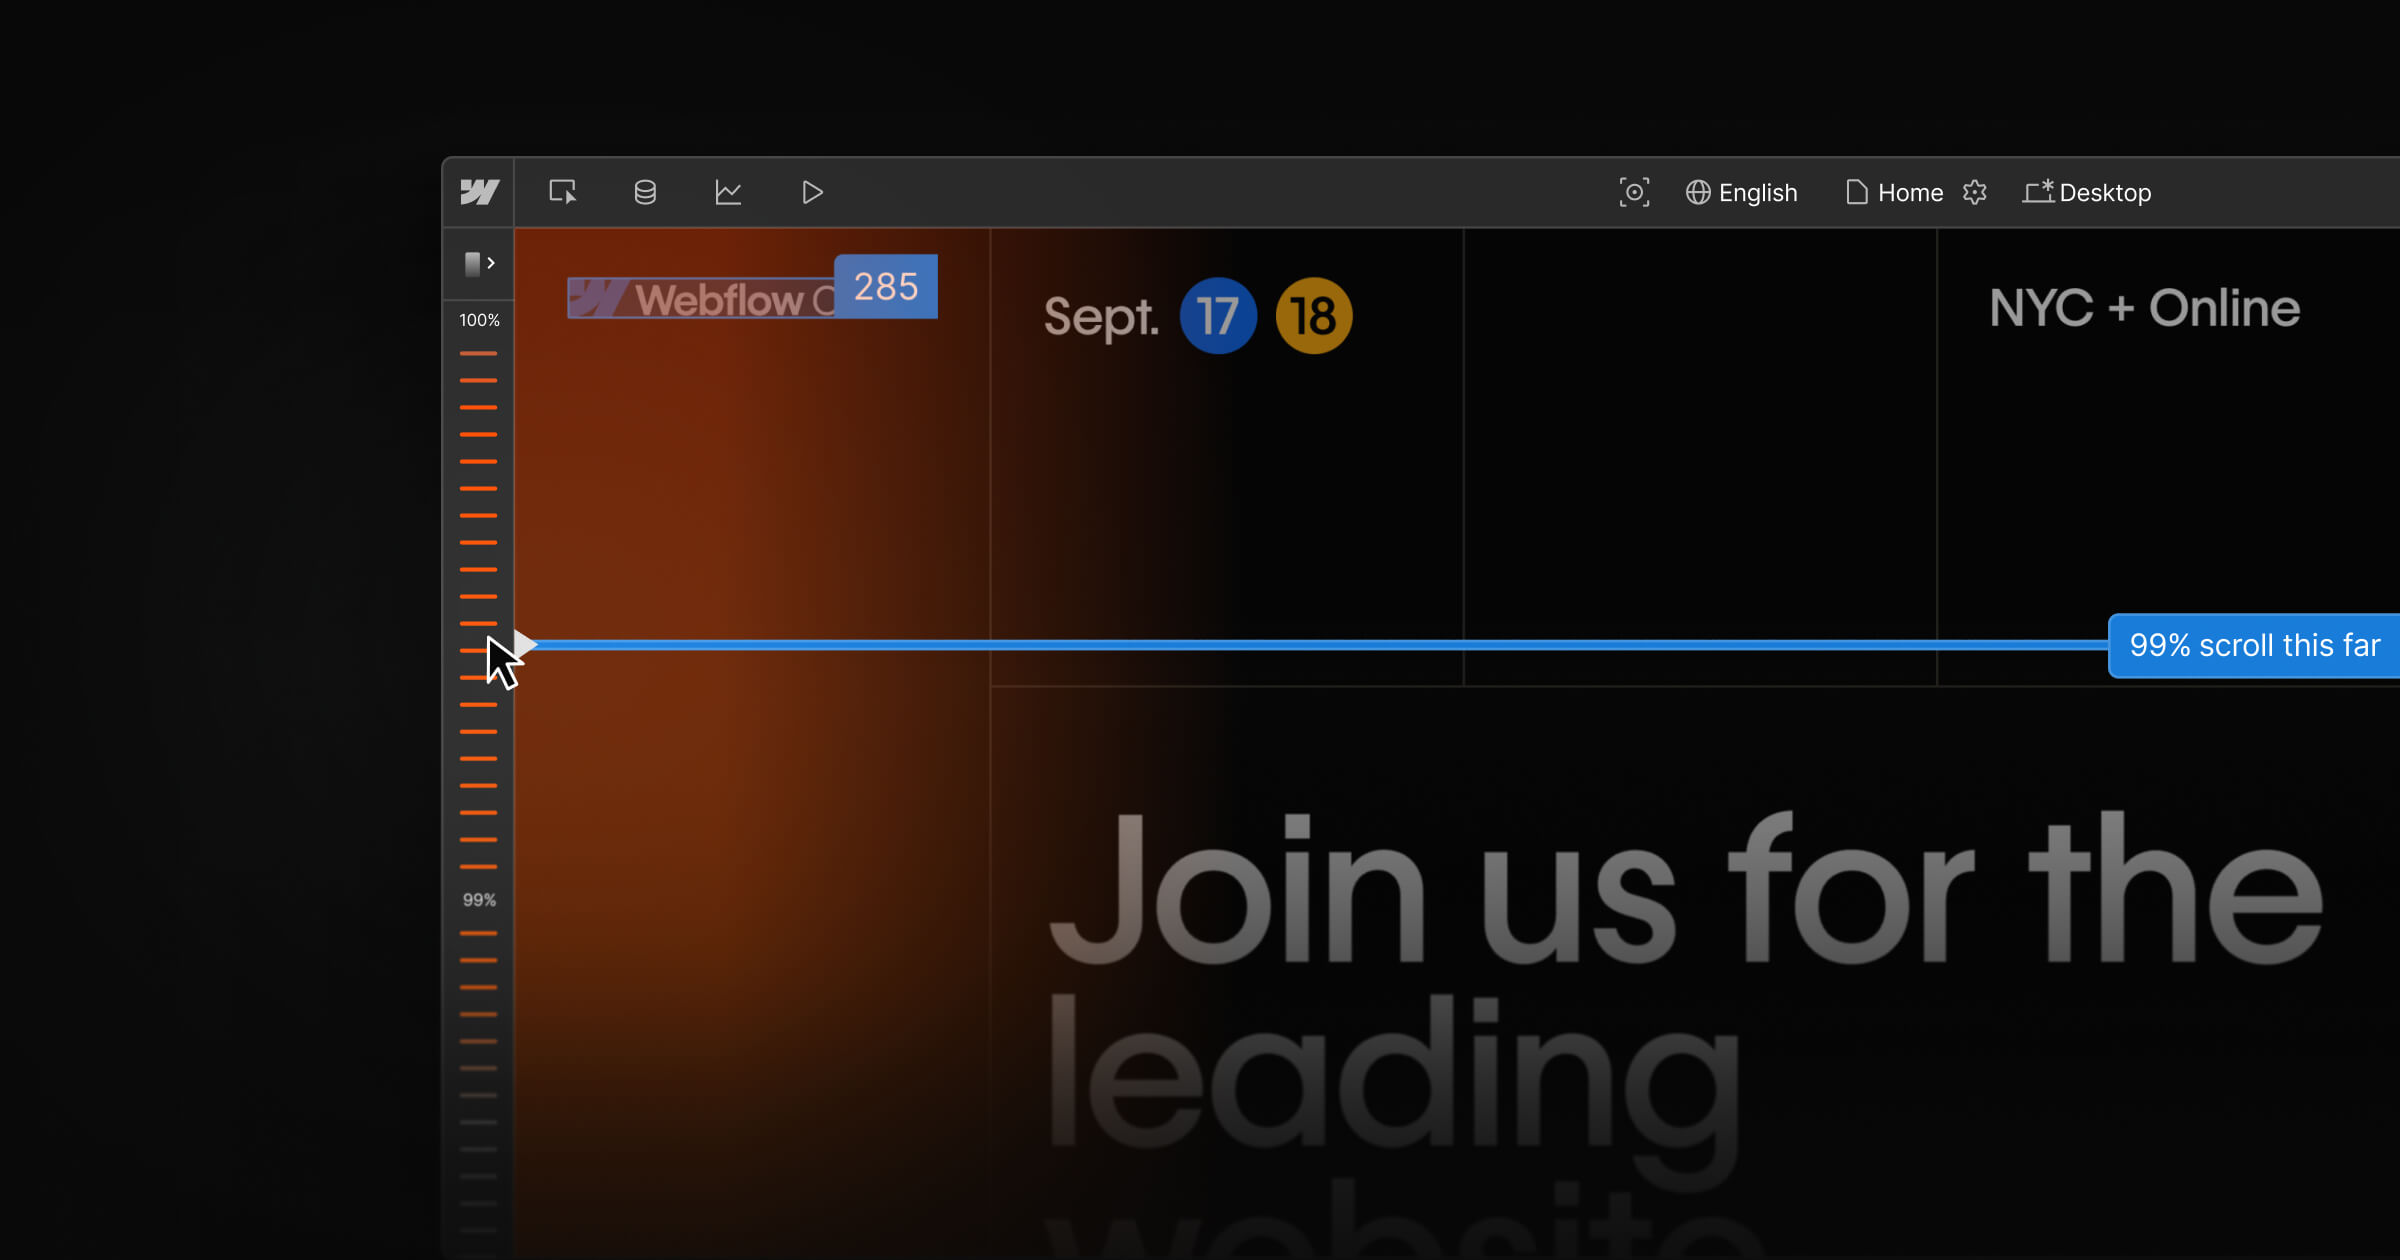
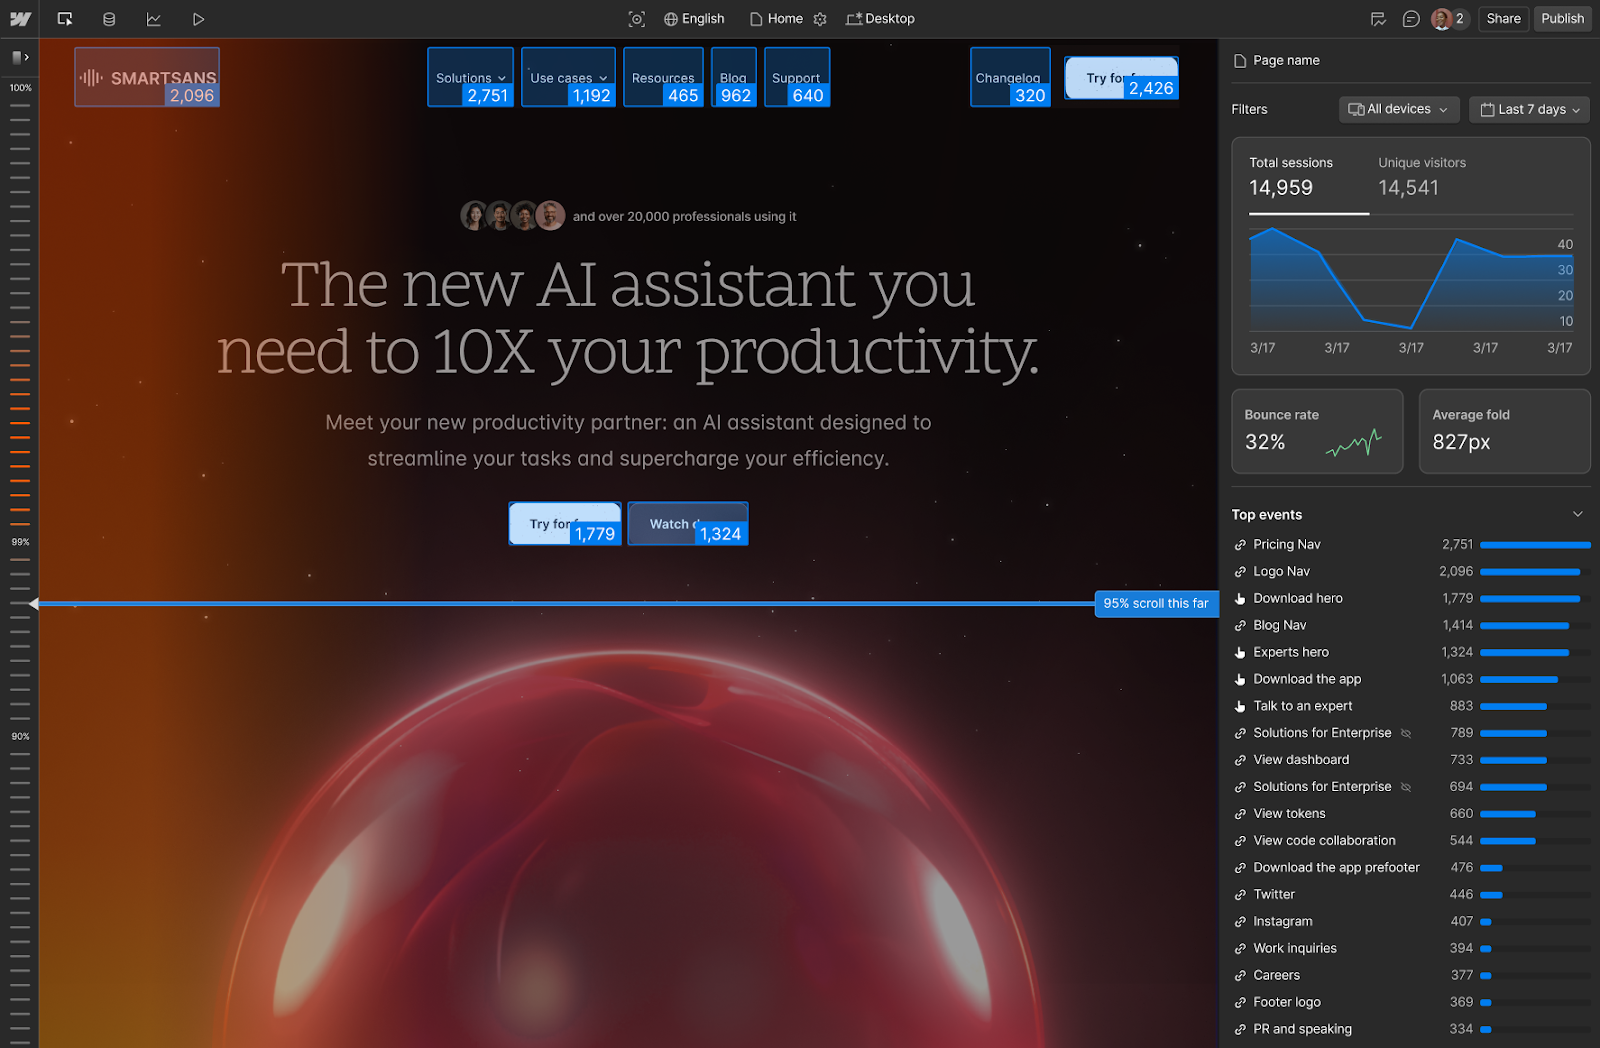
At its core, visual analytics are a way to see user behavior in context. Clickmaps show you exactly where visitors are clicking, revealing what’s attracting attention, what’s being ignored, and if visitors are taking the actions you intended. Scrollmaps, on the other hand, indicate how far down the page visitors are scrolling. They help answer questions like: Is important content visible? Are visitors dropping off before reaching a critical call to action?
Together, these tools offer an intuitive, real-time look at performance directly in the Webflow canvas. It’s analytics that speaks the same visual language as your design.
Your site, from their perspective
Visual analytics are now live in Webflow Analyze. They include:
- Clickmaps to highlight exactly where visitors are clicking on your site
- Scrollmaps to understand how far visitors scroll down a page before leaving
From guesswork to growth
For years, Webflow has helped teams visually build and launch sites with speed and flexibility. Visual analytics expands on that foundation, unlocking performance insights that were out of reach for the teams closest to the actual website work.
Teams can now see key behavior data — like where people are clicking or how far they’re scrolling — in the context of their design, right on the page. There’s no tagging or setup required, just direct visual feedback that helps answer questions like:
- Are visitors reaching the content we expect?
- Are certain elements being ignored?
- Where are visitors dropping off?
- Is a certain button placement getting more clicks than another?
- What are points of friction we can address?
Example: After launching a new mid-page feature section, a team noticed 70% of visitors dropped off just before reaching it. With scrollmaps, they identified and fixed the issue by repositioning the content for better visibility.
The result is less guesswork and fewer delays, plus a tighter connection between what you’re building, how it’s performing, and how it’s meeting (or not meeting) your audiences’ needs.
Made for teams who ship fast
We built visual analytics for designers, content editors, and marketers who care about performance but may lack a dedicated analytics function or easy access to the data they need. It empowers these teams to move fast and measure performance at a granular level — understanding engagement with individual components, navigation elements, and content blocks — so they can make real-time, data-backed decisions.
With visual analytics there is:
- No learning curve: Insights are embedded in the canvas and mapped to real elements.
- No setup required: It works out of the box without tagging or scripting.
- No invasive tracking: Privacy-conscious by design, with no session replay.
It’s analytics built to match your speed, work with your tools, and align with your goals.
Launch, learn, ideate, iterate.
For many teams, shipping a site is just the beginning. The real work is what comes next — understanding how the site is performing and optimizing for the outcomes that matter.
Visual analytics make optimization a continuous part of your workflow. Track how a new layout performs, test different button placements, or fix a friction point as soon as it appears.
It’s a faster feedback loop with fewer blockers. No more waiting for reports, translating data across teams or context switching from different tools. Just actionable insight, in context, as part of your design process.
And because it surfaces behavior visually, like where visitors are clicking, pausing, or dropping off, it sparks instant ideas for what to try next, helping teams see their site from a visitor’s perspective. Let’s explore how this situation played out on our own site, where visual analytics uncovered a friction point and unlocked a substantial lift in conversions:
How visual analytics drove a 10% lift in signups on our pricing page
Insight
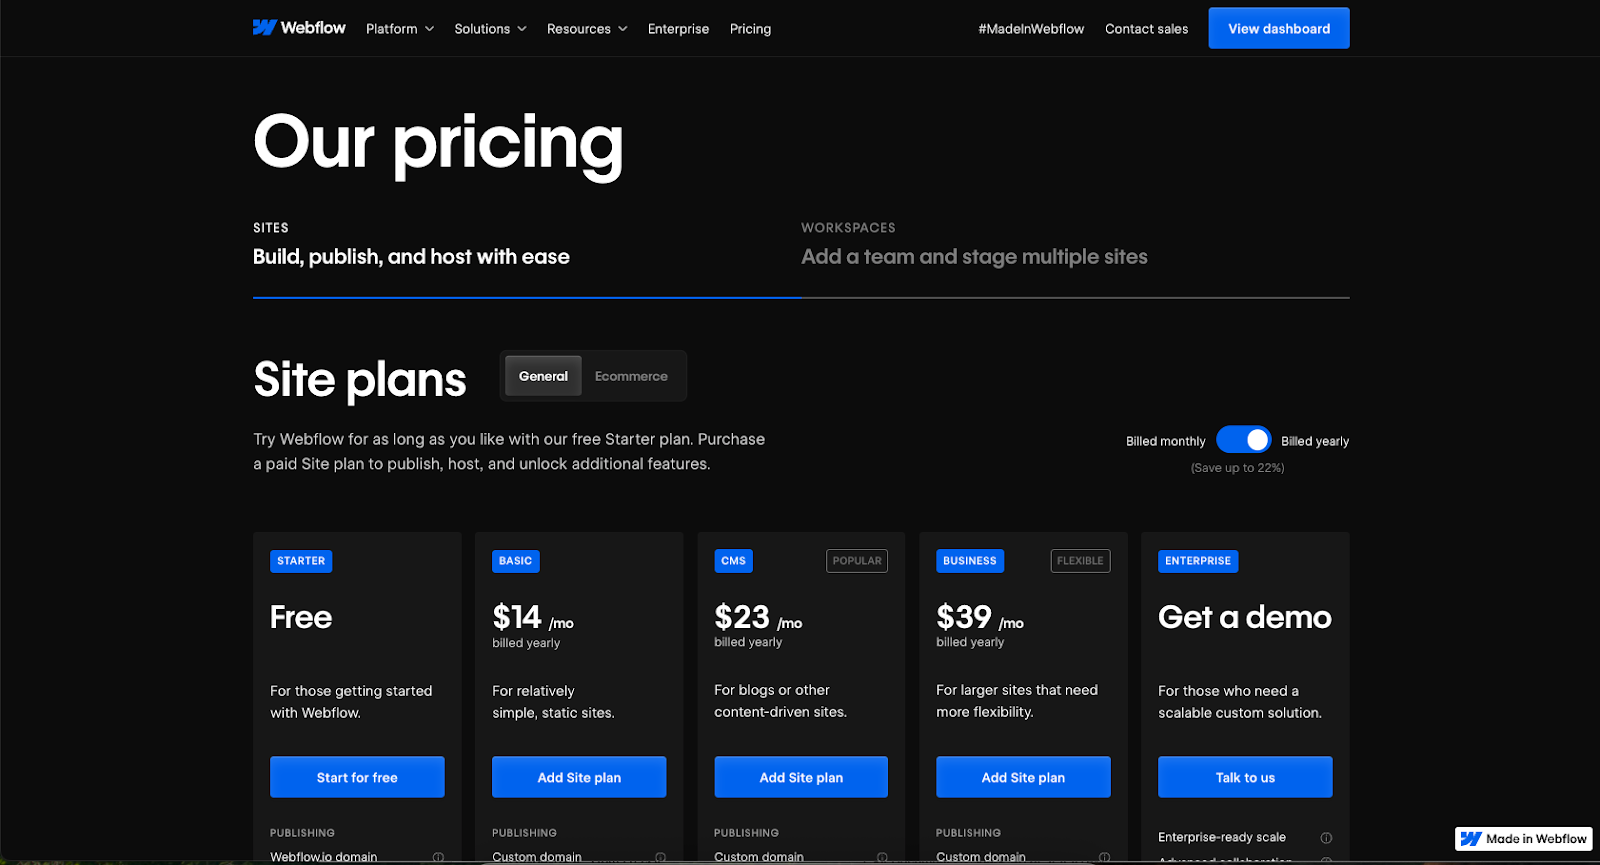
Using visual analytics on our own site, our Growth team discovered that visitors weren’t engaging with our plan CTAs as expected. After digging in, they noticed that a long header was pushing CTAs too far down the page, placing them below the fold for most visitors.
Change
They shortened the header copy to reduce the vertical space and pull the CTAs higher up on the page.
Result
This quick adjustment led to a 10% lift in signups — no A/B testing or complex analysis. Just a fast, impactful change driven by clear visual behavior data.
"Visual analytics gives us instant clarity on simple changes that can meaningfully improve conversion rates. It's become one of our most important levers for turning insights into quick wins."
- Elliott Chapman, Director, Growth Marketing, Webflow
The future of data is visual
Visual analytics from Webflow is the first step in reimagining how data insight fits into the creative process. It’s analytics that speak your language, built into the environment where you already work.
And we’re just getting started. Watch this space for more news — including deeper insights (right on the canvas) into how visitors are interacting with your site, and AI-powered recommendations to help you identify what to improve next.
Sites with the Analyze add-on can now access clickmaps and scrollmaps. If you’re new to Analyze, you can get started or learn more here.


Start using Analyze today
Webflow Analyze puts a native, unified view of visitor behavior into the hands of designers and content marketers — so you can make data-backed decisions that improve site performance.