

Feature
Website management
Introducing Clickmaps in Webflow Analyze
Webflow Analyze now supports clickmaps. See visitor interactions, overlaid directly on the canvas, so you can make better design decisions faster.
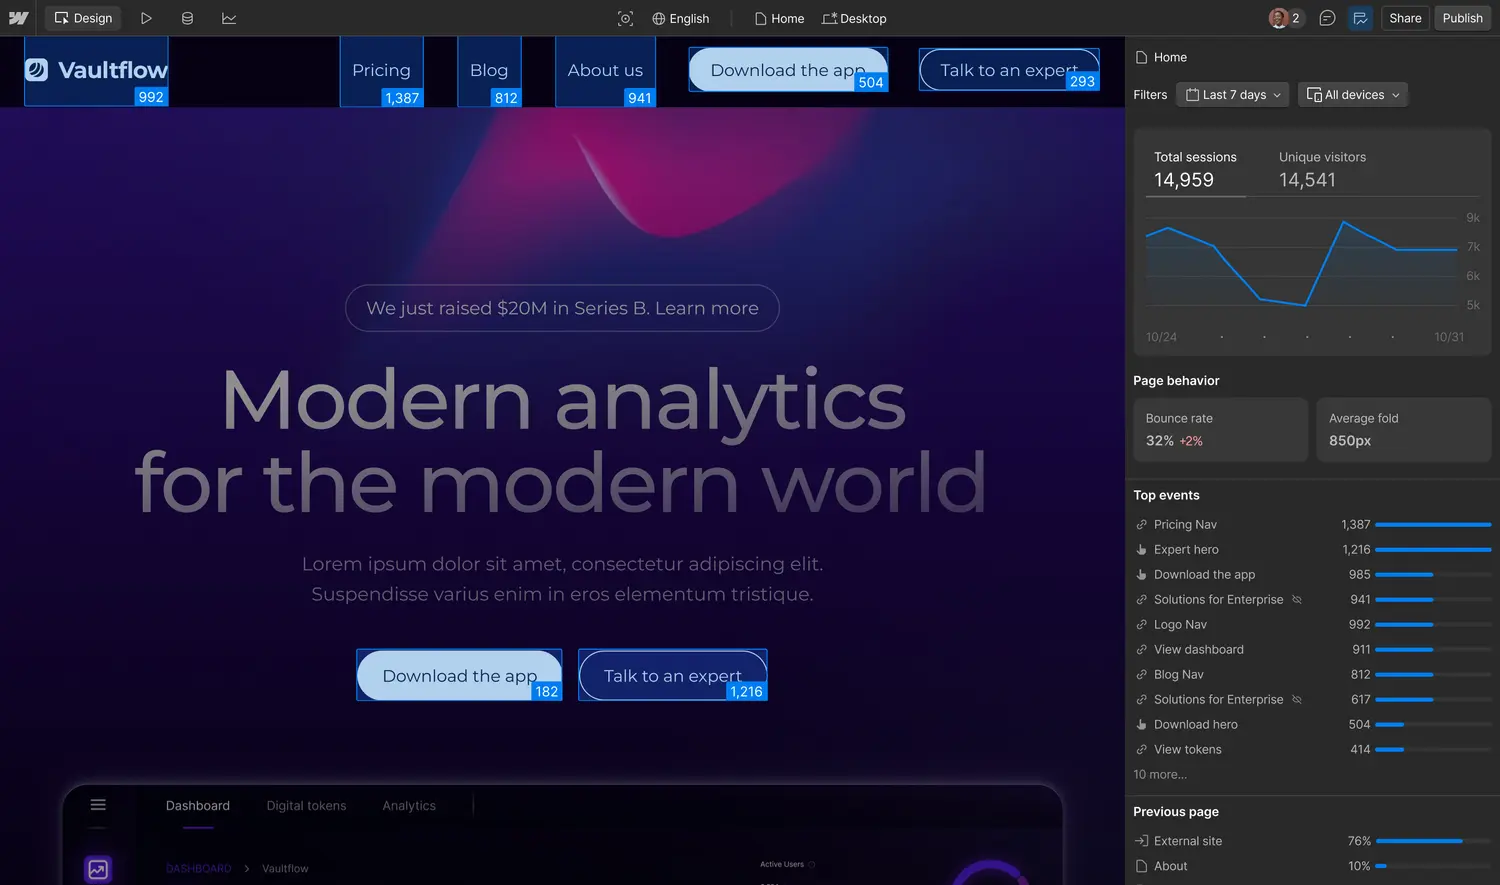
Today we're excited to introduce a new visual analytics feature in Webflow Analyze: clickmaps.
Clickmaps bring instant visibility into how visitors interact with your site. No setup, tagging, instrumentation, or dashboards required.
Designers, writers, and marketers make decisions every day about what to prioritize on a page: Which CTAs deserve top billing? Is the navigation working? Are visitors actually clicking on the content that matters? But too often, those decisions are based on hunches or are hidden behind tools that feel disconnected from the site building process.
The introduction of clickmaps in Webflow Analyze changes this. Now, you can view real visitor engagement data overlaid on the canvas in Analyze Mode. When data is easy to see and understand, it’s easier to act on. Clickmaps collapses the gap between noticing what needs to change and making that change, so your team can build more engaging, higher-performing experiences with confidence and speed.
For customers already using Webflow Analyze, head to Analyze Mode on your site. Interested in adding Analyze to your Webflow site? Get started here, or learn more about Analyze here.
Related updates
.png)
.jpg)
.jpg)


Get started for free
Try Webflow for as long as you like with our free Starter plan. Purchase a paid Site plan to publish, host, and unlock additional features.
Try Webflow for as long as you like with our free Starter plan. Purchase a paid Site plan to publish, host, and unlock additional features.