
You’ve built a beautiful website and launched it for the world to see.
You have a stunning hero page, captivating interactions, and content for days. But how can you tell if your website is actually reaching its intended audience? If a website falls in the forest and there’s no one around to see it, does it make a sound?
You need to measure your website performance to make sure you connect with your target audience and serve their needs effectively. The data should also tell you if your website is helping you reach the goals that led you to create it in the first place. You can use performance insights to boost engagement with your site, maximize traffic, and drive conversions. Think of website performance metrics as the constructive criticism of the website world — it will tell you what you’re doing well and identify the areas you need to improve.
1. Understand why you should measure website performance
It is important to measure website performance because it allows you to evaluate how well your site is serving your audience. The data you gather will help you identify problems with your website. If a feature is getting lost, a user flow isn’t getting visitors to the right place, or a call-to-action (CTA) isn’t working — the data should surface the issue.
Measuring website performance will also give you the insights you need to improve traffic and engagement. When you measure performance regularly, you get a consistent health check on your website. Then, you can start making improvements and measure the impact, developing your site in a data-driven, informed way.
2. Get to know your tools
The primary tool you will be using to measure your website performance is Google Analytics. Google Analytics can be challenging at first, but it’s a powerful tool once you get it set up. Luckily, it has a wealth of information to get you started, including free online courses at Analytics Academy, a thorough Help Center, and an active online community.
Additional tools include:
- Google Search Console to improve your Google search performance.
- PageSpeed Insights to measure the technical performance of your site, which can affect the visitor experience.
- Ahrefs to get further search engine optimization (SEO) and competitor insight.
- Clearscope to improve your writing for SEO.
- Built-in tools that your website platform or hosting service may have that give you some information about your site.


SEO and Webflow: the essential guide
Get 13 need-to know tips on website SEO — whether or not you use Webflow.
3. Identify which KPIs to measure
To measure your performance, you need to decide which key performance indicators (KPIs) you want to track. Your specific KPIs will depend on the type of website and industry you’re in, but there are some fundamental metrics everyone will want to look at.
Measuring specific KPIs will help you track performance at each step of the customer journey. They will also allow you to answer important questions along the route. Did your target audience find your site? How do they find your site? What do they do once they’re there? How long do they stay on your site, and how far do they explore it? And finally, do they take the next step to engage more deeply with your product or service?
Audience reach and impact
Measure audience reach to find out how many potential customers visit your site. Measure impact to see how many of them visit your site and then convert into customers. We can look at Google Analytics to see how to do this using Audience Overview.
To measure audience reach and impact, look at Users and Active Users. This will tell you how many unique visitors your website has. You can also measure Sessions, which looks at the period of time that the user is active on your site. If a visitor comes back multiple times or spends more than 30 minutes active on your site, it will register as multiple sessions.
You can look at these metrics for a specific duration or time period. You can also segment which type of users you are looking at — for example, users who ended up signing up for your newsletter. In the example below, we can see website data for February and the number of users, new users, sessions, and sessions per user the website has received.
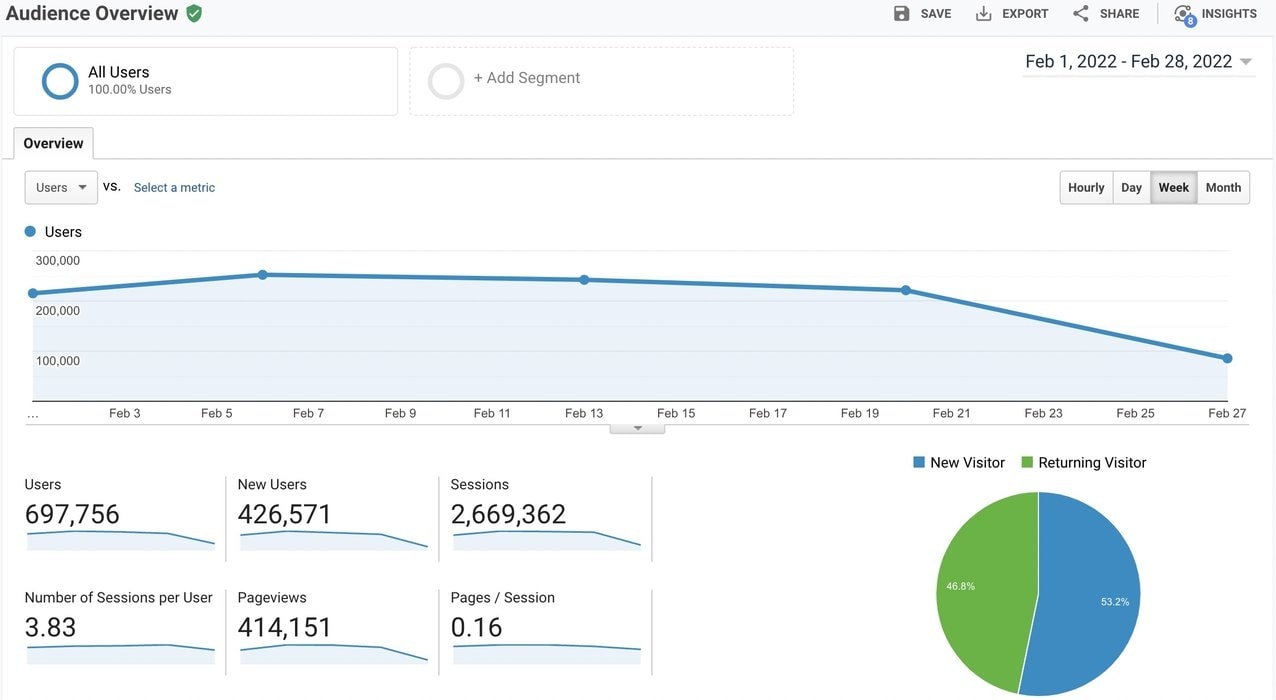
You want to see a healthy mix of new and returning users. That will tell you that your current audience is happy and visiting often, and your web presence is growing and finding new audiences.
Traffic source
Want to figure out how people are finding your site? Track traffic sources! This time, find Acquisition in the left-hand menu of your Google Analytics dashboard, and click All Traffic, Source/Medium. Before the slash is the specific source (e.g., Facebook, Google, YouTube), and after the slash is the medium of that source (e.g., email, referral, paid-social).

Here’s what each of the mediums indicates:
- Direct - This is traffic coming from visitors typing in your URL or using a bookmark. These are people familiar with your site who are revisiting it. Direct traffic indicates you’ve built a regular following, and people are finding regular value from it so they keep coming back.
- Organic - These are visitors who find your site via search, generally Google. High numbers for organic search tell you that your site is ranking for good keywords, and you are finding new audiences that way.
- Referral - Visitors are coming from backlinks to your site from other websites and news sources. Referrals indicate that you are being talked about, and your site is viewed as a valuable reference.
- Social - Visitors are coming from social media. You are being linked to and talked about by customers and fans on their social media channels.
- Email - Traffic is coming from your email campaigns or newsletters. This can indicate how well your email marketing is working and whether subscribers are actually clicking through to your site.
And to see the impact of your Google search ad campaigns, toggle to the Google Ads menu under Acquisition. Here, you’ll be able to see how successful your advertising efforts are and whether or not the monetary investment is worth it.
Bounce rate and session duration
Bounce rate refers to when a visitor opens a single page on your site and then closes it without exploring further. If visitors are bouncing quickly (based on session time), it often indicates they didn’t find what they were looking for. Lower bounce rates and longer session times also raise your search ranking, so good results can compound their impact.
A high bounce rate may also mean that you have the right information, but it’s not easy to find. You might want to improve your user journey. It could also be that your keywords are finding the wrong audience. It’s not just about ranking for keywords; it's about ranking for the right keywords. Revisit your SEO strategy to attract the audience that is actually going to benefit from your website.

You can find the overall bounce rate for your site under Audience - Overview. If you want to look deeper, you can see what types of visitors are bouncing more frequently via Channels, All Traffic, or All Pages.
You can also look at the Average Session Duration and Pages per Session. These will give you further data about visitor behavior. If visitors are spending long periods of time on your site and exploring more pages, it may mean they are finding value in your site and may be more likely to convert.
Conversion rate
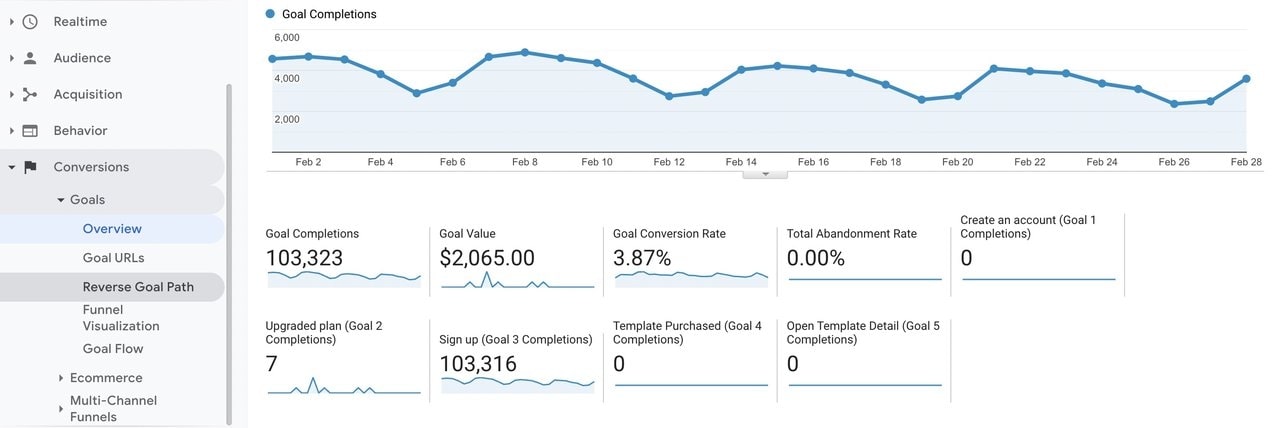
Conversion measures how many customers take a specific desired action — a “goal” — toward engaging more deeply with your website or product. You don’t just want visitor volume; you want the right visitors — those who are interested in signing up or becoming customers.
How good the data is that you get from the conversion rate depends entirely on how well you’ve decided which goals to track. A conversion goal could be downloading content, signing up for a newsletter, creating an account, signing up for a free trial, or purchasing a product. Set the goals that have the biggest business impact on your business.
To increase conversion, refine your user journey and make sure you have effective calls-to-action (CTAs) placed frequently and strategically throughout your site. A call-to-action encourages a visitor to take an action that gets them more involved with your business — to convert. A call-to-action could be:
- Learn More
- Download Now
- Contact Us
- Request a Quote
- Sign up
Visitors may not need to explore your entire site to know they want to sign up, which is why you should include CTAs throughout your site, not just at the end of a user journey.
Page load time and technical performance
While technical site performance is an entire topic by itself, it’s important to note that elements like page load speed and site uptime can have a big impact on a visitor’s experience. Google’s algorithm updates have also tended to weigh a site’s technical performance higher in search engine rankings in recent years.
Page load time has a huge impact on conversion, with the first five seconds having the biggest impact. Measure your performance with PageSpeed Insights to make sure your site will be fast and easy to use for visitors. You can also incorporate some easy performance optimization features using your website development platform.

4. Use your data insights to improve site performance
Metrics give you important data about your website. But measuring alone is not enough. What truly makes a difference is using the data on hand to inform future changes you make to your website.
Measuring site performance also isn’t a one-and-done activity. You should build a habit of checking each of these metrics on a regular basis. You can then make strategic adjustments to your website and measure the specific impact of each change.
There are many approaches you can take to boost your metrics once you have a solid baseline to begin measuring. You might:
- Improve your UI or UX design.
- Fix confusing navigation on your site.
- Improve internal linking in your content.
- Write more useful content.
- Target more effective keywords.
- Improve your technical SEO optimization.
- Create clearer calls-to-action.
- Improve your interactions and visual design.
Whatever you decide to do from here, you can be confident you are creating a more effective website, giving your audience what they need, and making informed decisions backed by data.